Understand vulneralability along your entire route with a lidar based model that provides actionable intelligence for…
- Set maintenance priorities and budget planning.
- Focus storm planning or recovery.
- Reroute trail or road.
- Culvert site suitability.
- Ponding of water.
- Road deactivations.
The Erosion Potential Report (EPR) empowers trail and road managers to establish science based budgets for erosion control along their entire linear network.
The slope classes presented within this app will be equally useful to the canyoneer, search and rescue, wildland firefighter, hiker, or any other user of the natural world where slope angle is a key factor in decision making.
3D Rooftop Metrics from Lidar Point cloud.
High Precision, Slope adjusted, Rooftop metrics derived from Lidar Point cloud. This mapping methodology is unincumbered by tree cover or shadow and provides high precision rooftop metrics, and more from a .las file.
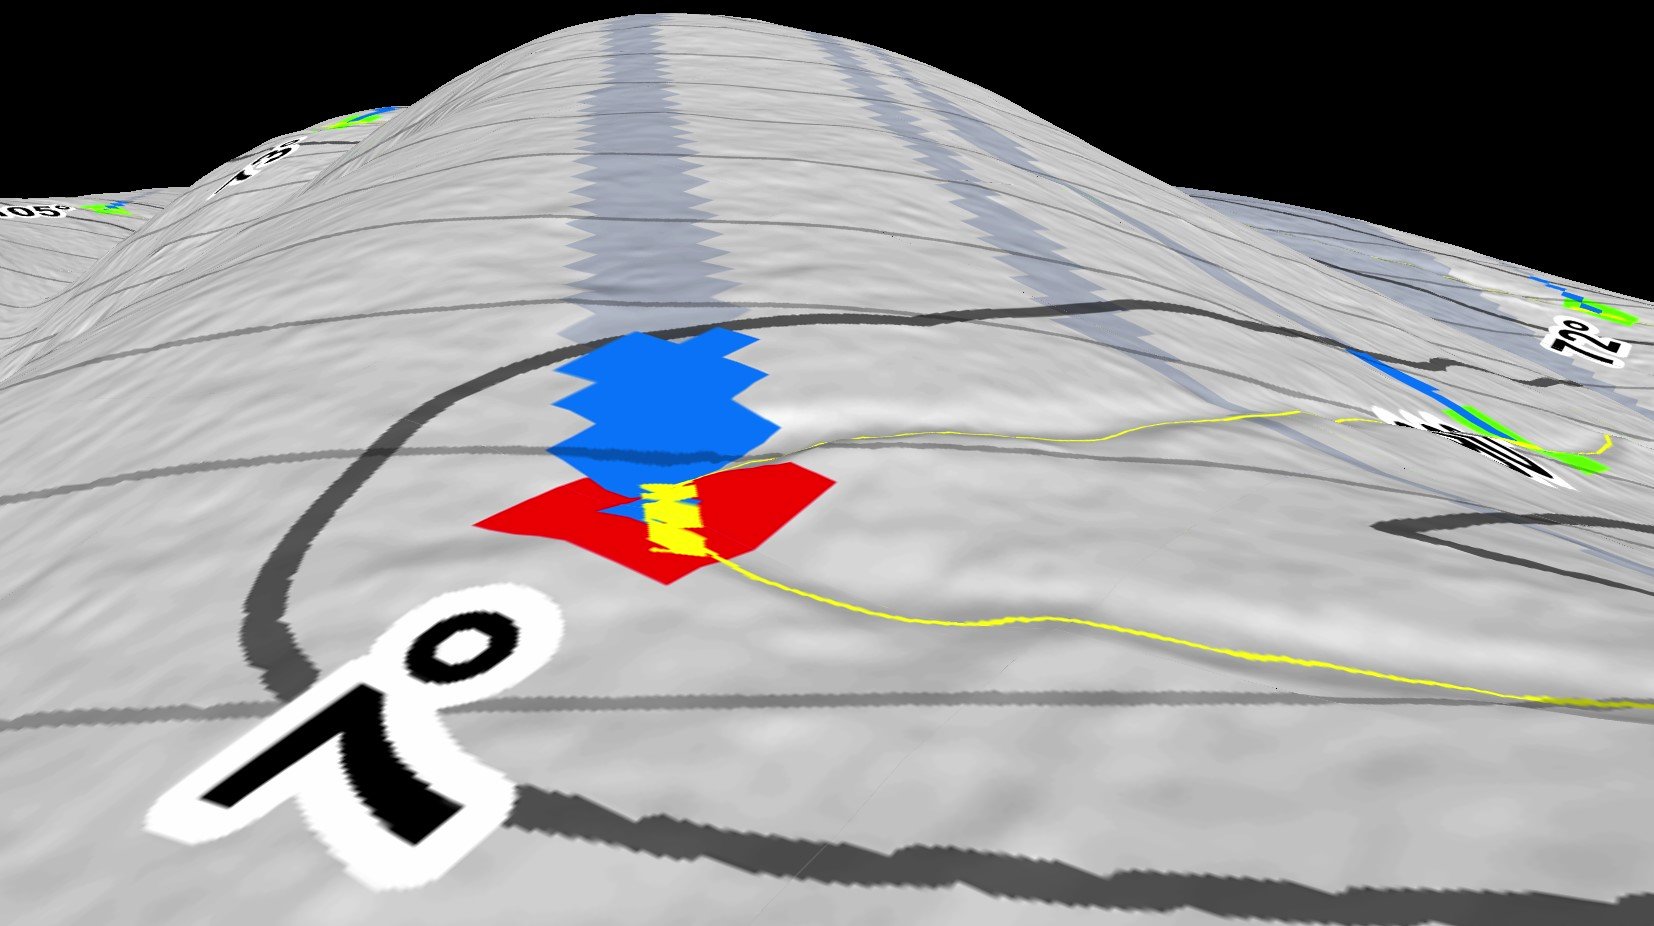
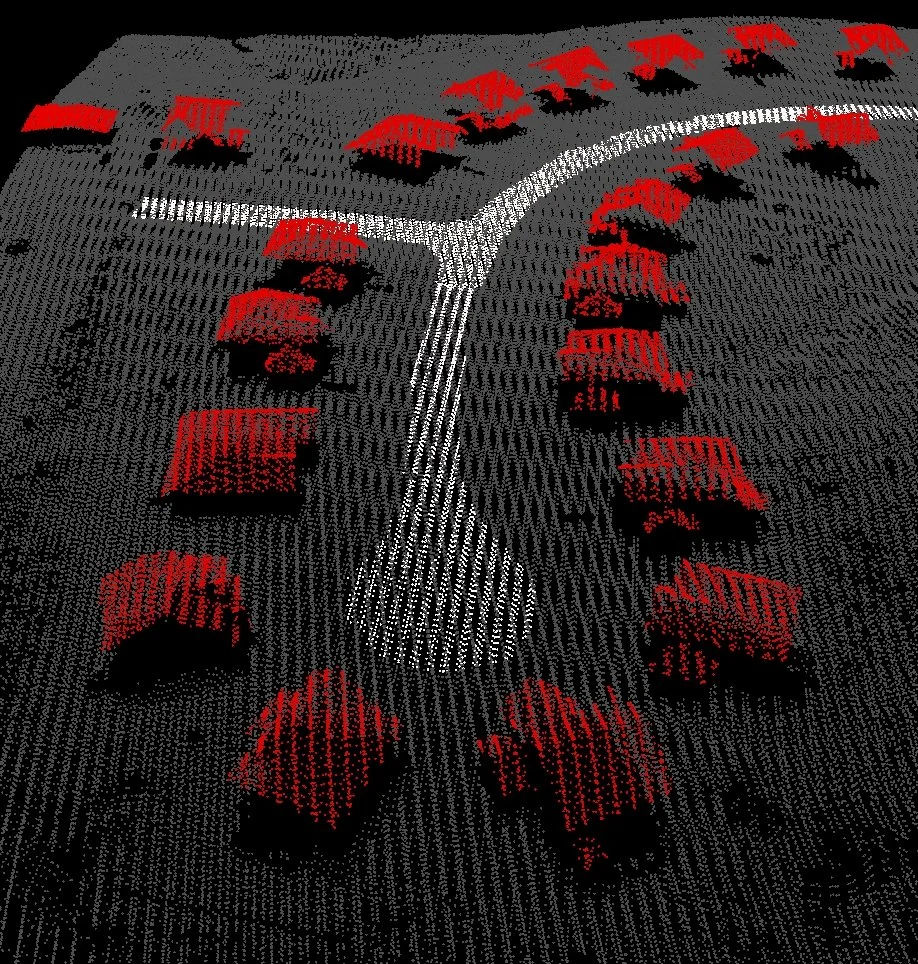
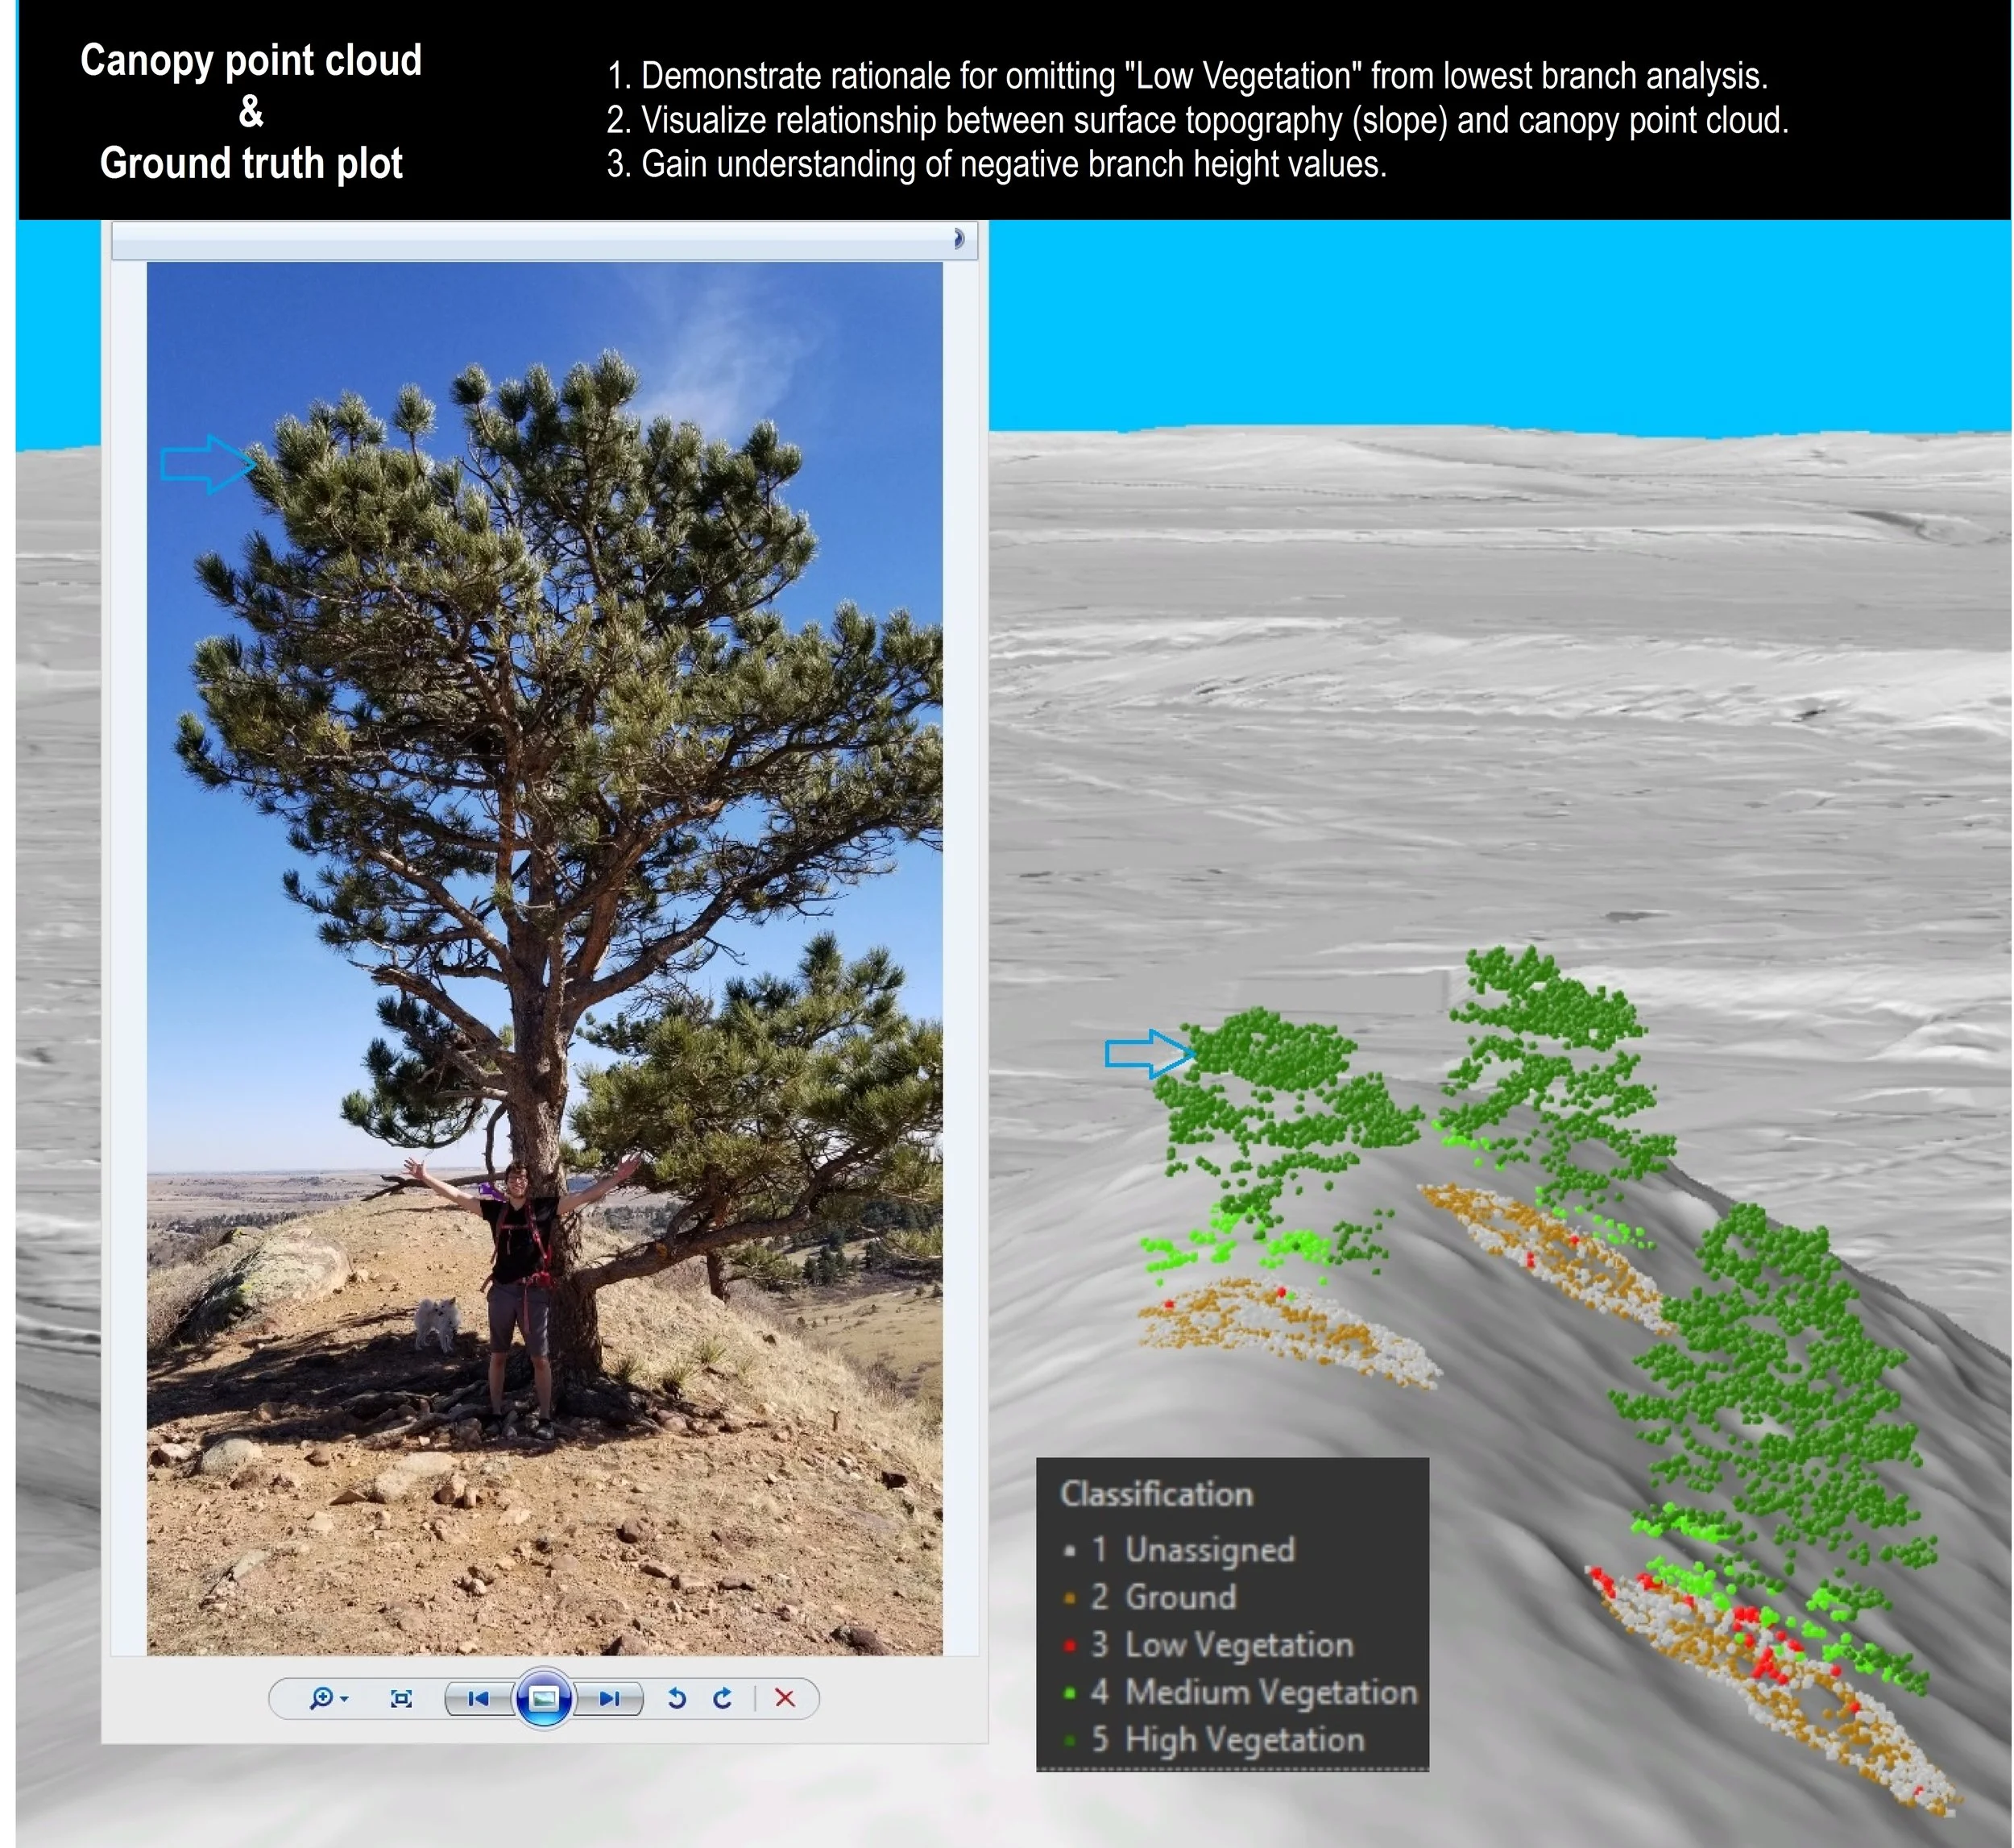
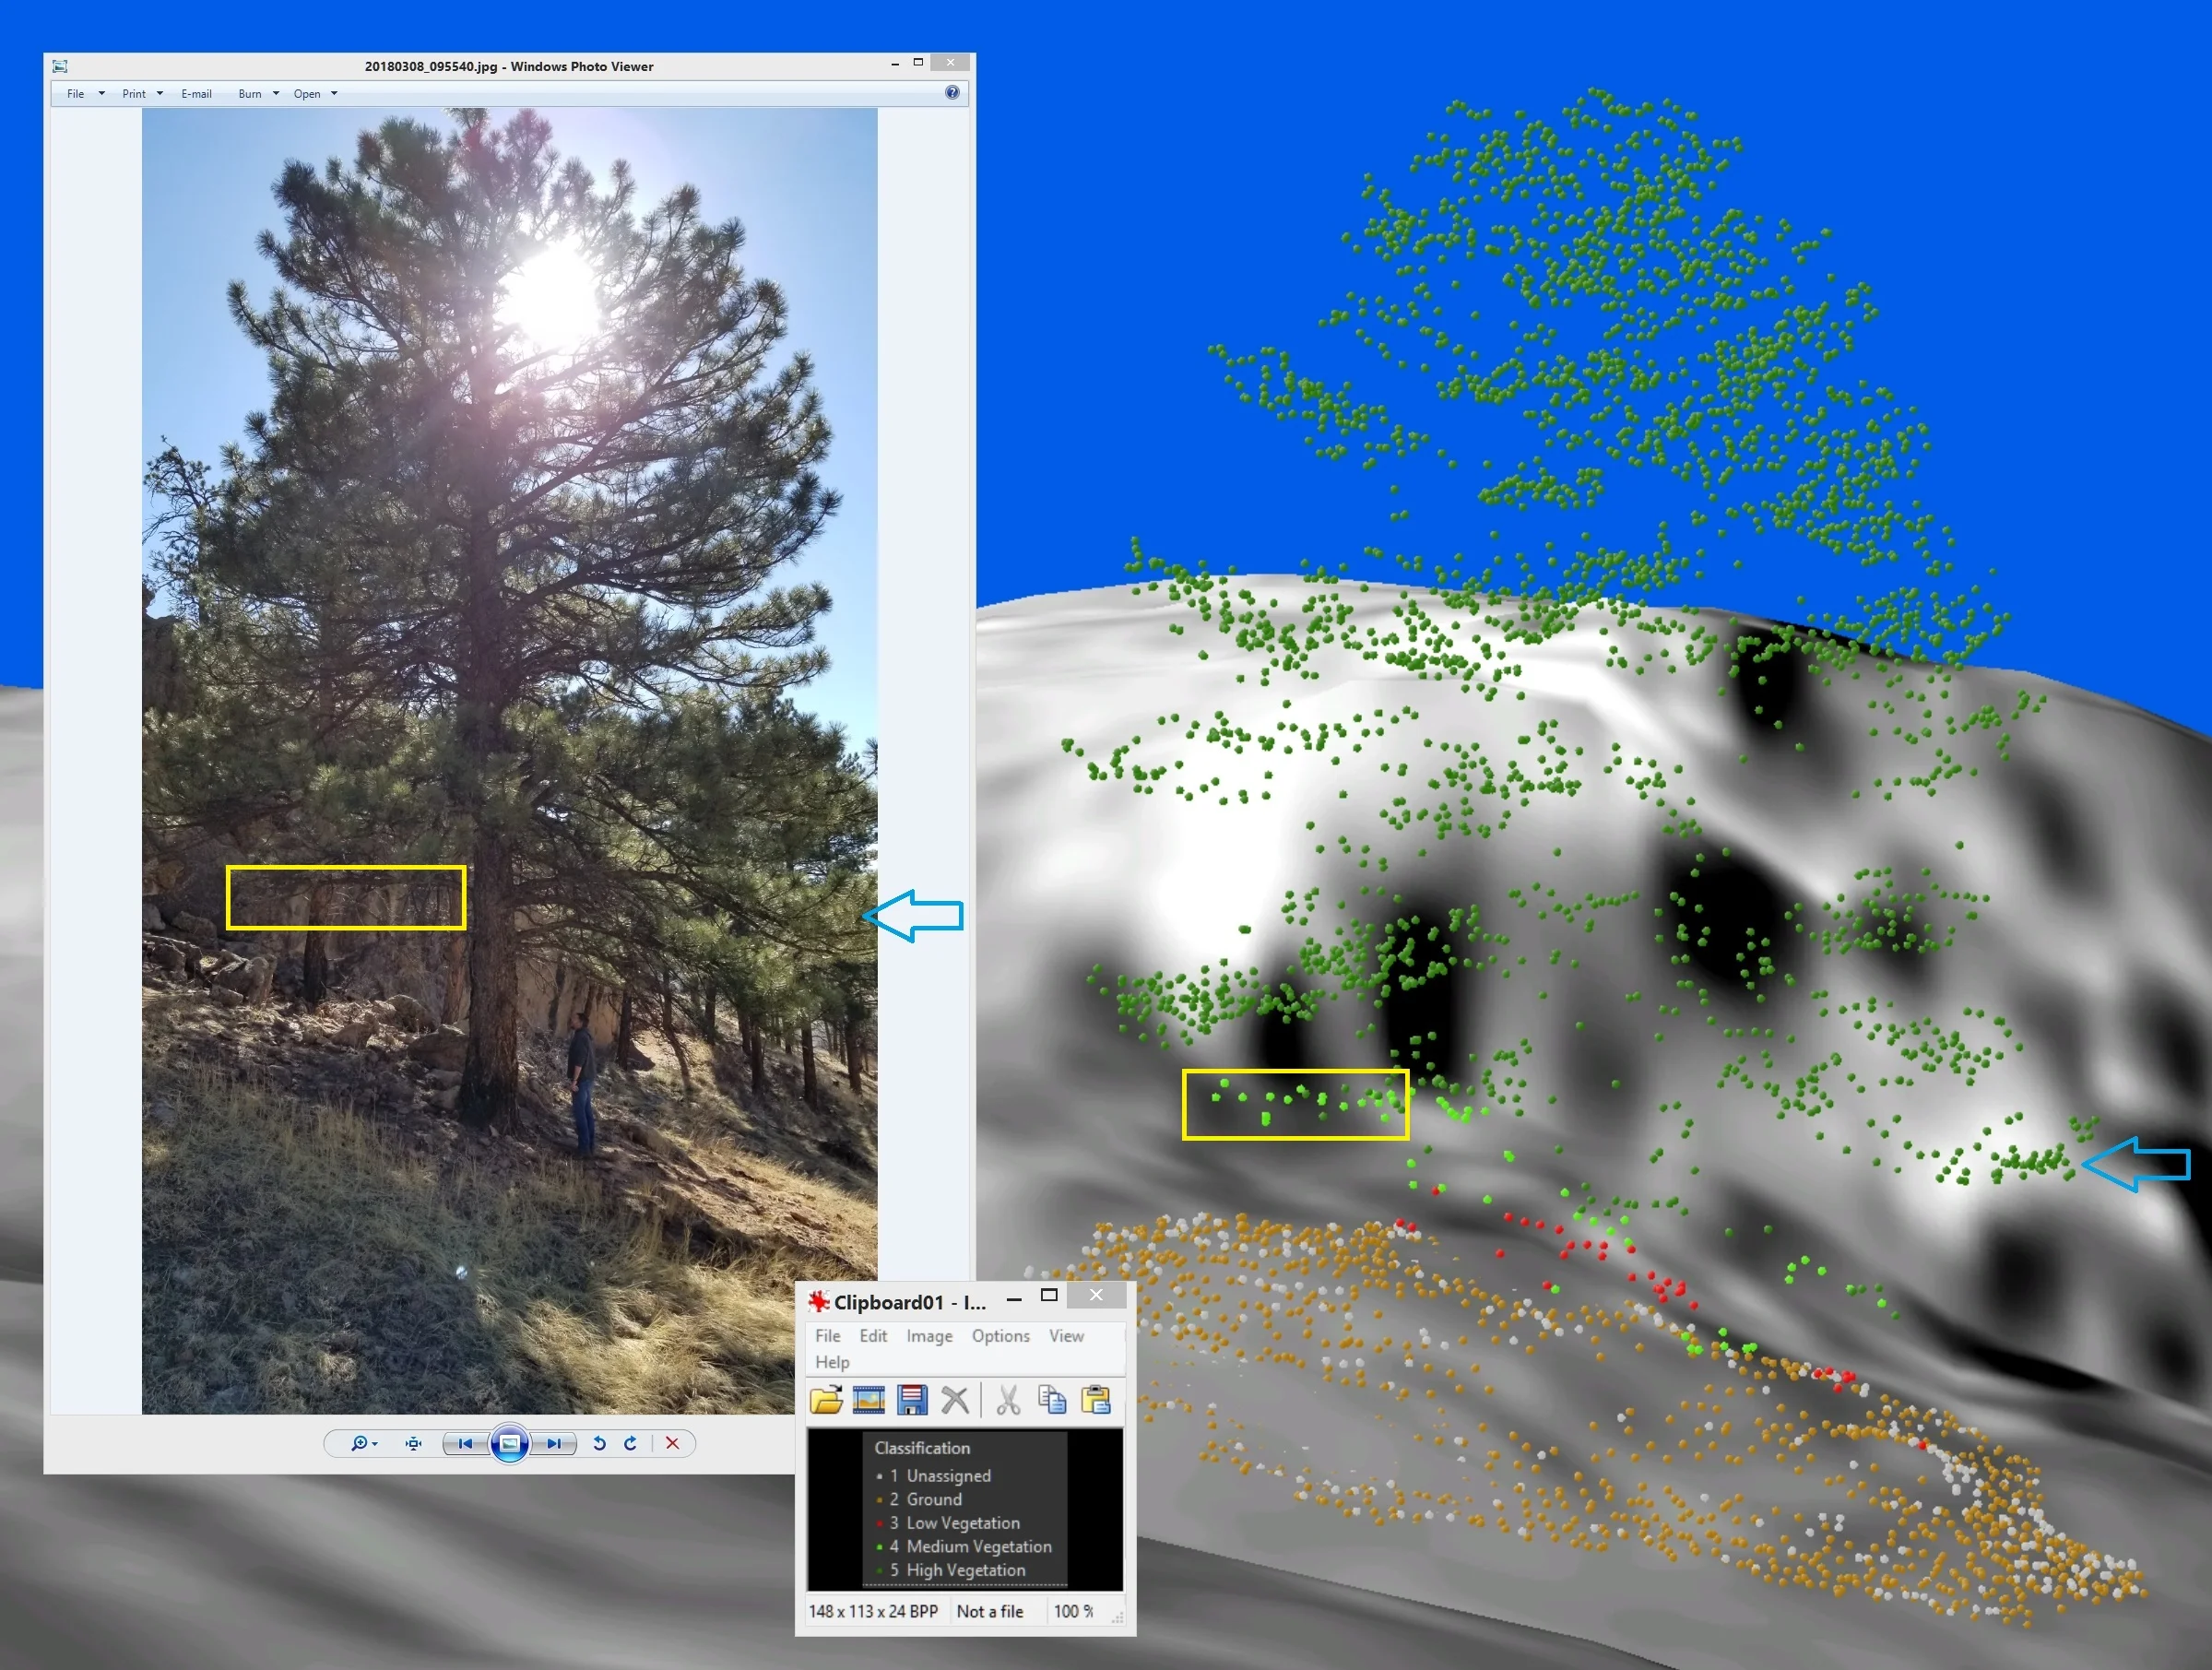
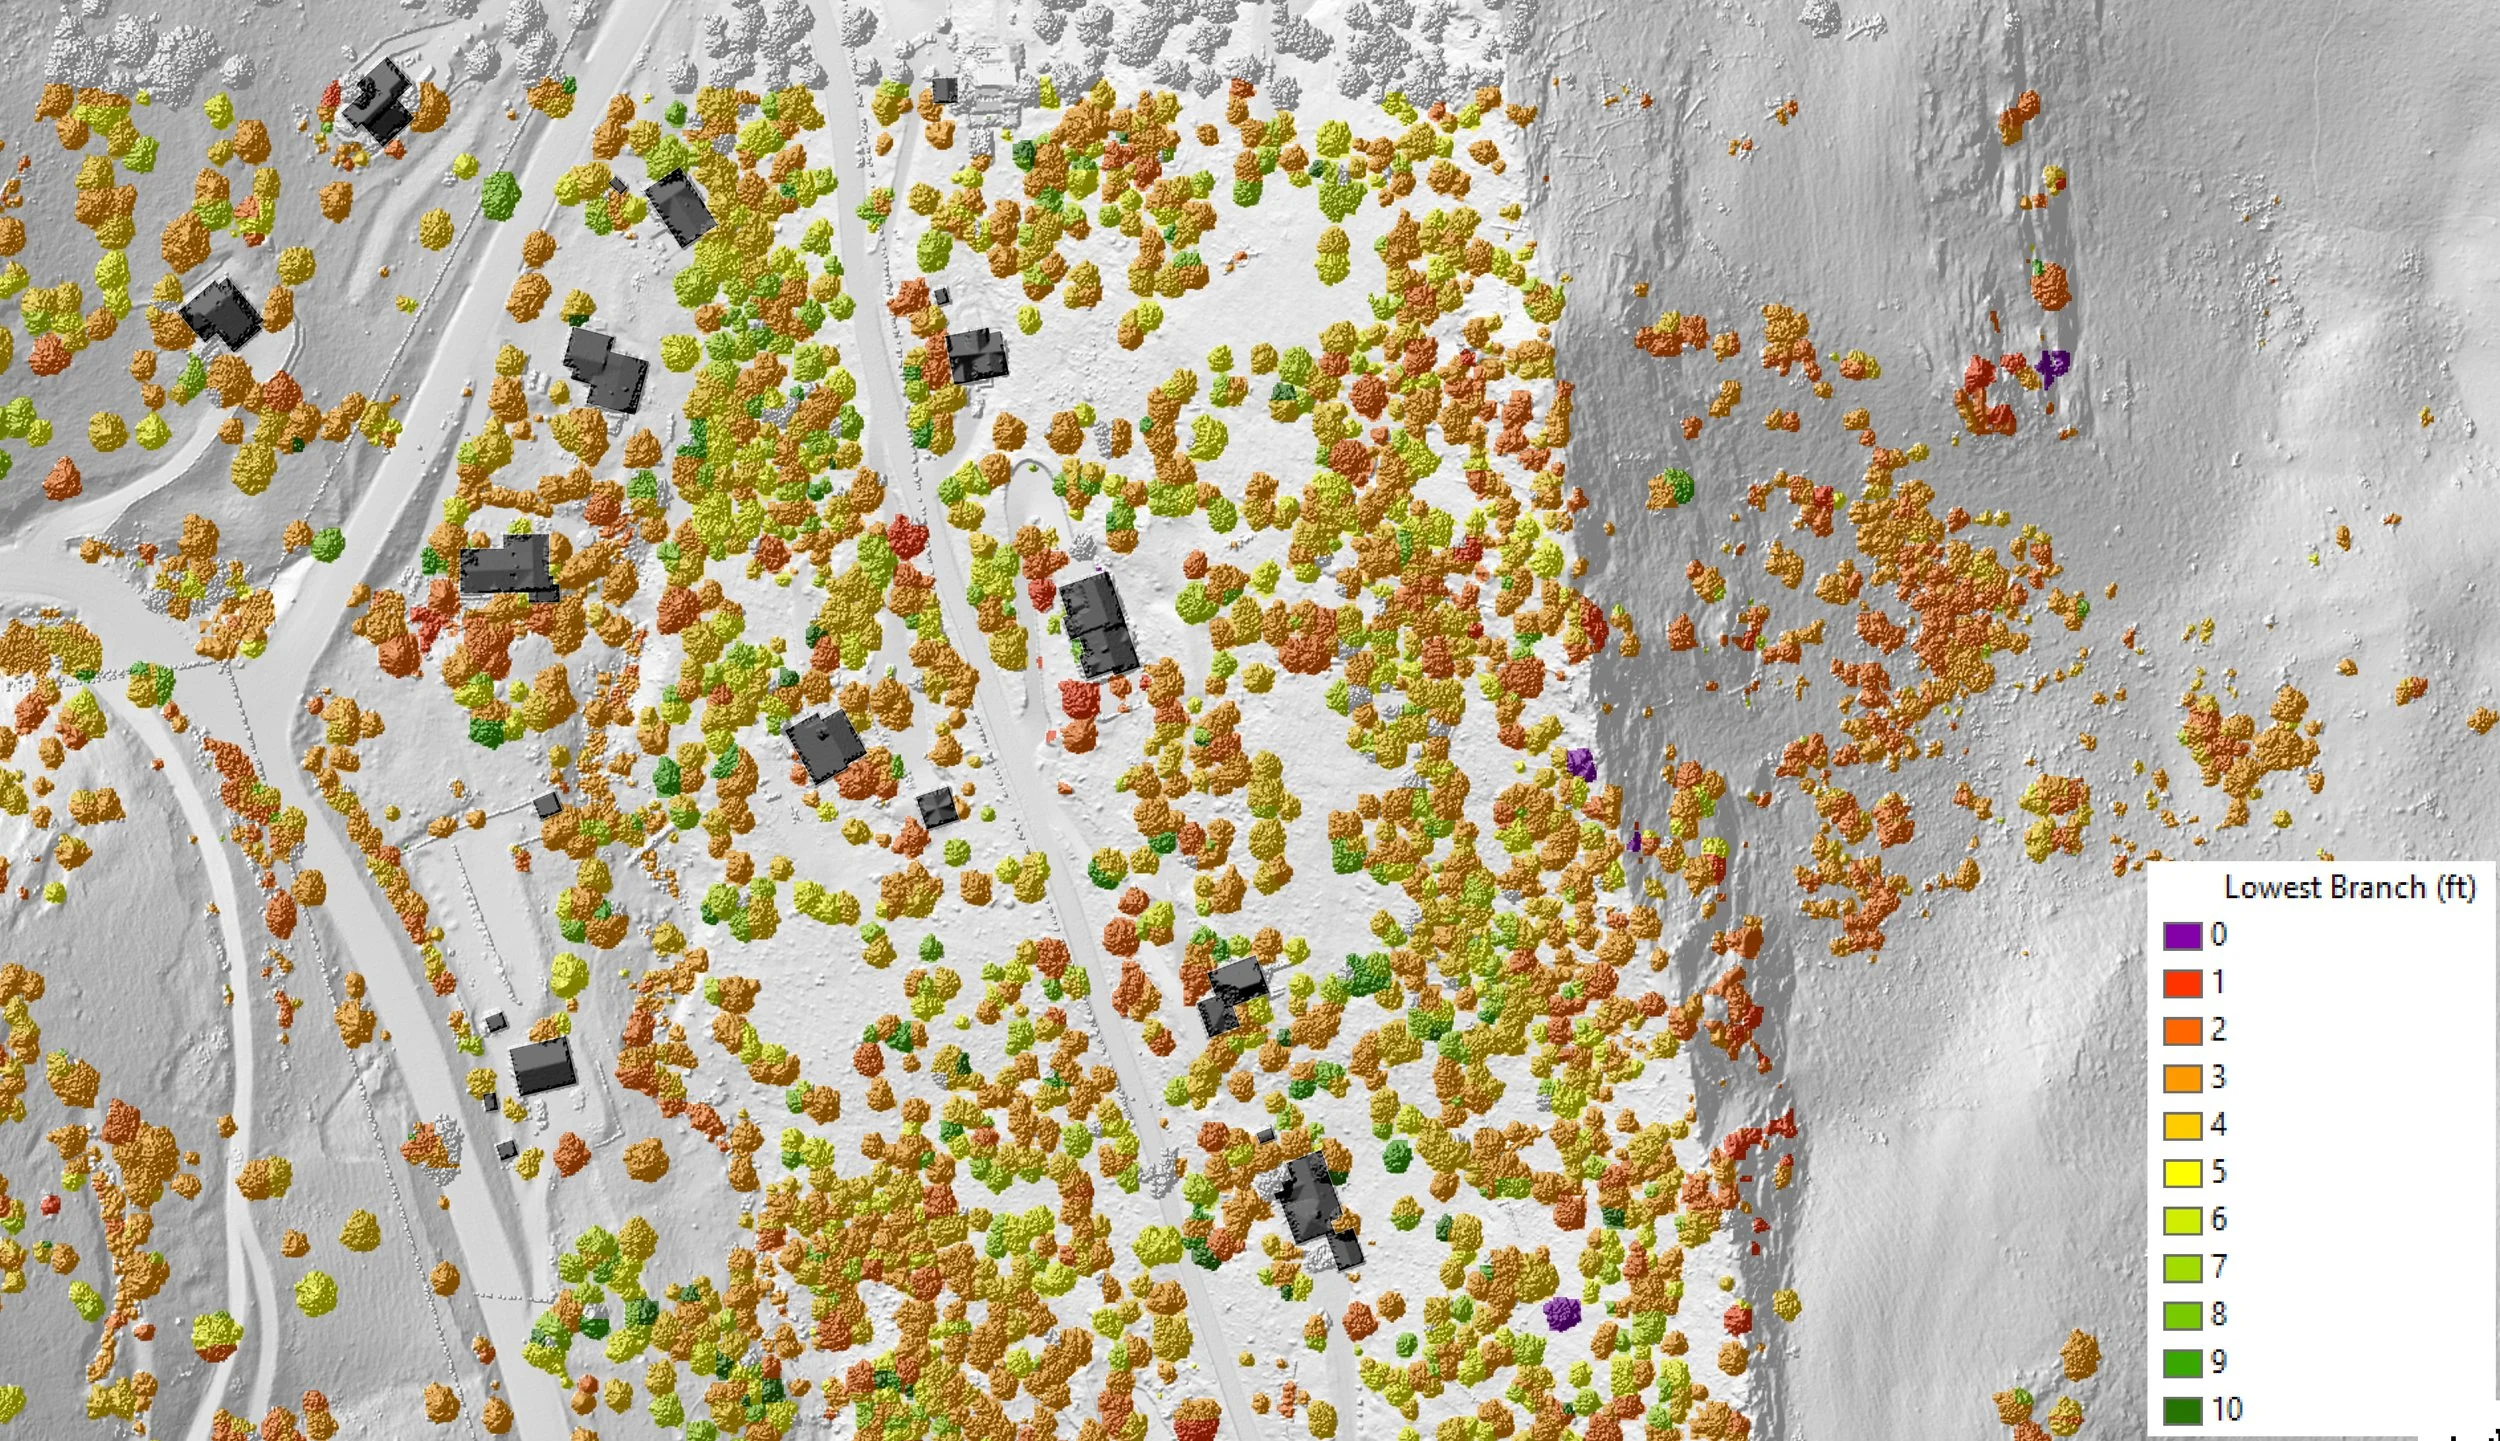
Lowest Branch analysis from Lidar point cloud.
I developed an ArcPro model builder toolbox that resolved the lowest branch height (from ground) of >1.5 million trees within the city of Boulder Open Space and Mountain Parks landbase. Deliverables included a ESRI raster dataset for use in a larger wildfire model being developed by NCAR, and for use by city staff to guide forest thinning operations for wildfire mitigation, and finally the ArcPro model for future comparative analysis. The images and maps below provide some insight into the project.


Cut/Fill - Lidar Based Wetland Restoration.
Using ArcGIS Model Builder 10.6, I calculated volume estimates for 8 ponds and the fill available on site for use in this wetland creation project. Bathymetric point data was interpolated with care to provide best available pond volume estimates, while I used our 2” pixel lidar based DEM for local fill volume estimates. Phase 1 of the model was to interpolate bathymetric data into a raster that snapped to my lidar DEM, Phase 2 was the pile volume estimates and Phase 3 will be to integrate groundwater elevations into the surface volume estimates. The groundwater observations will be used to adjust the elevation parameters of the surface volume tool to produce estimates closer to the desired outcome of wanting groundwater to be within 1 foot of ground surface
- Air Quality / raster analysis
I was GIS project manager and co-author on a published study that looked at PM2.5 concentrations to determine areas suitable for clean stove exchange subsidies. These data visualizations represent some of the products presented to policy makers and public at an open house event in City of Cranbrook, BC, Canada.
Click HERE for published paper (Air Quality, Atmosphere & Health)


- risk analysis: calgary fire service response
I provided extensive spatial data analysis for a risk modelling exercise designed to identify areas for improvement within city fire response zone.
Risk was defined by a complex algorithm combining, for example, time of response, and resources available on scene.


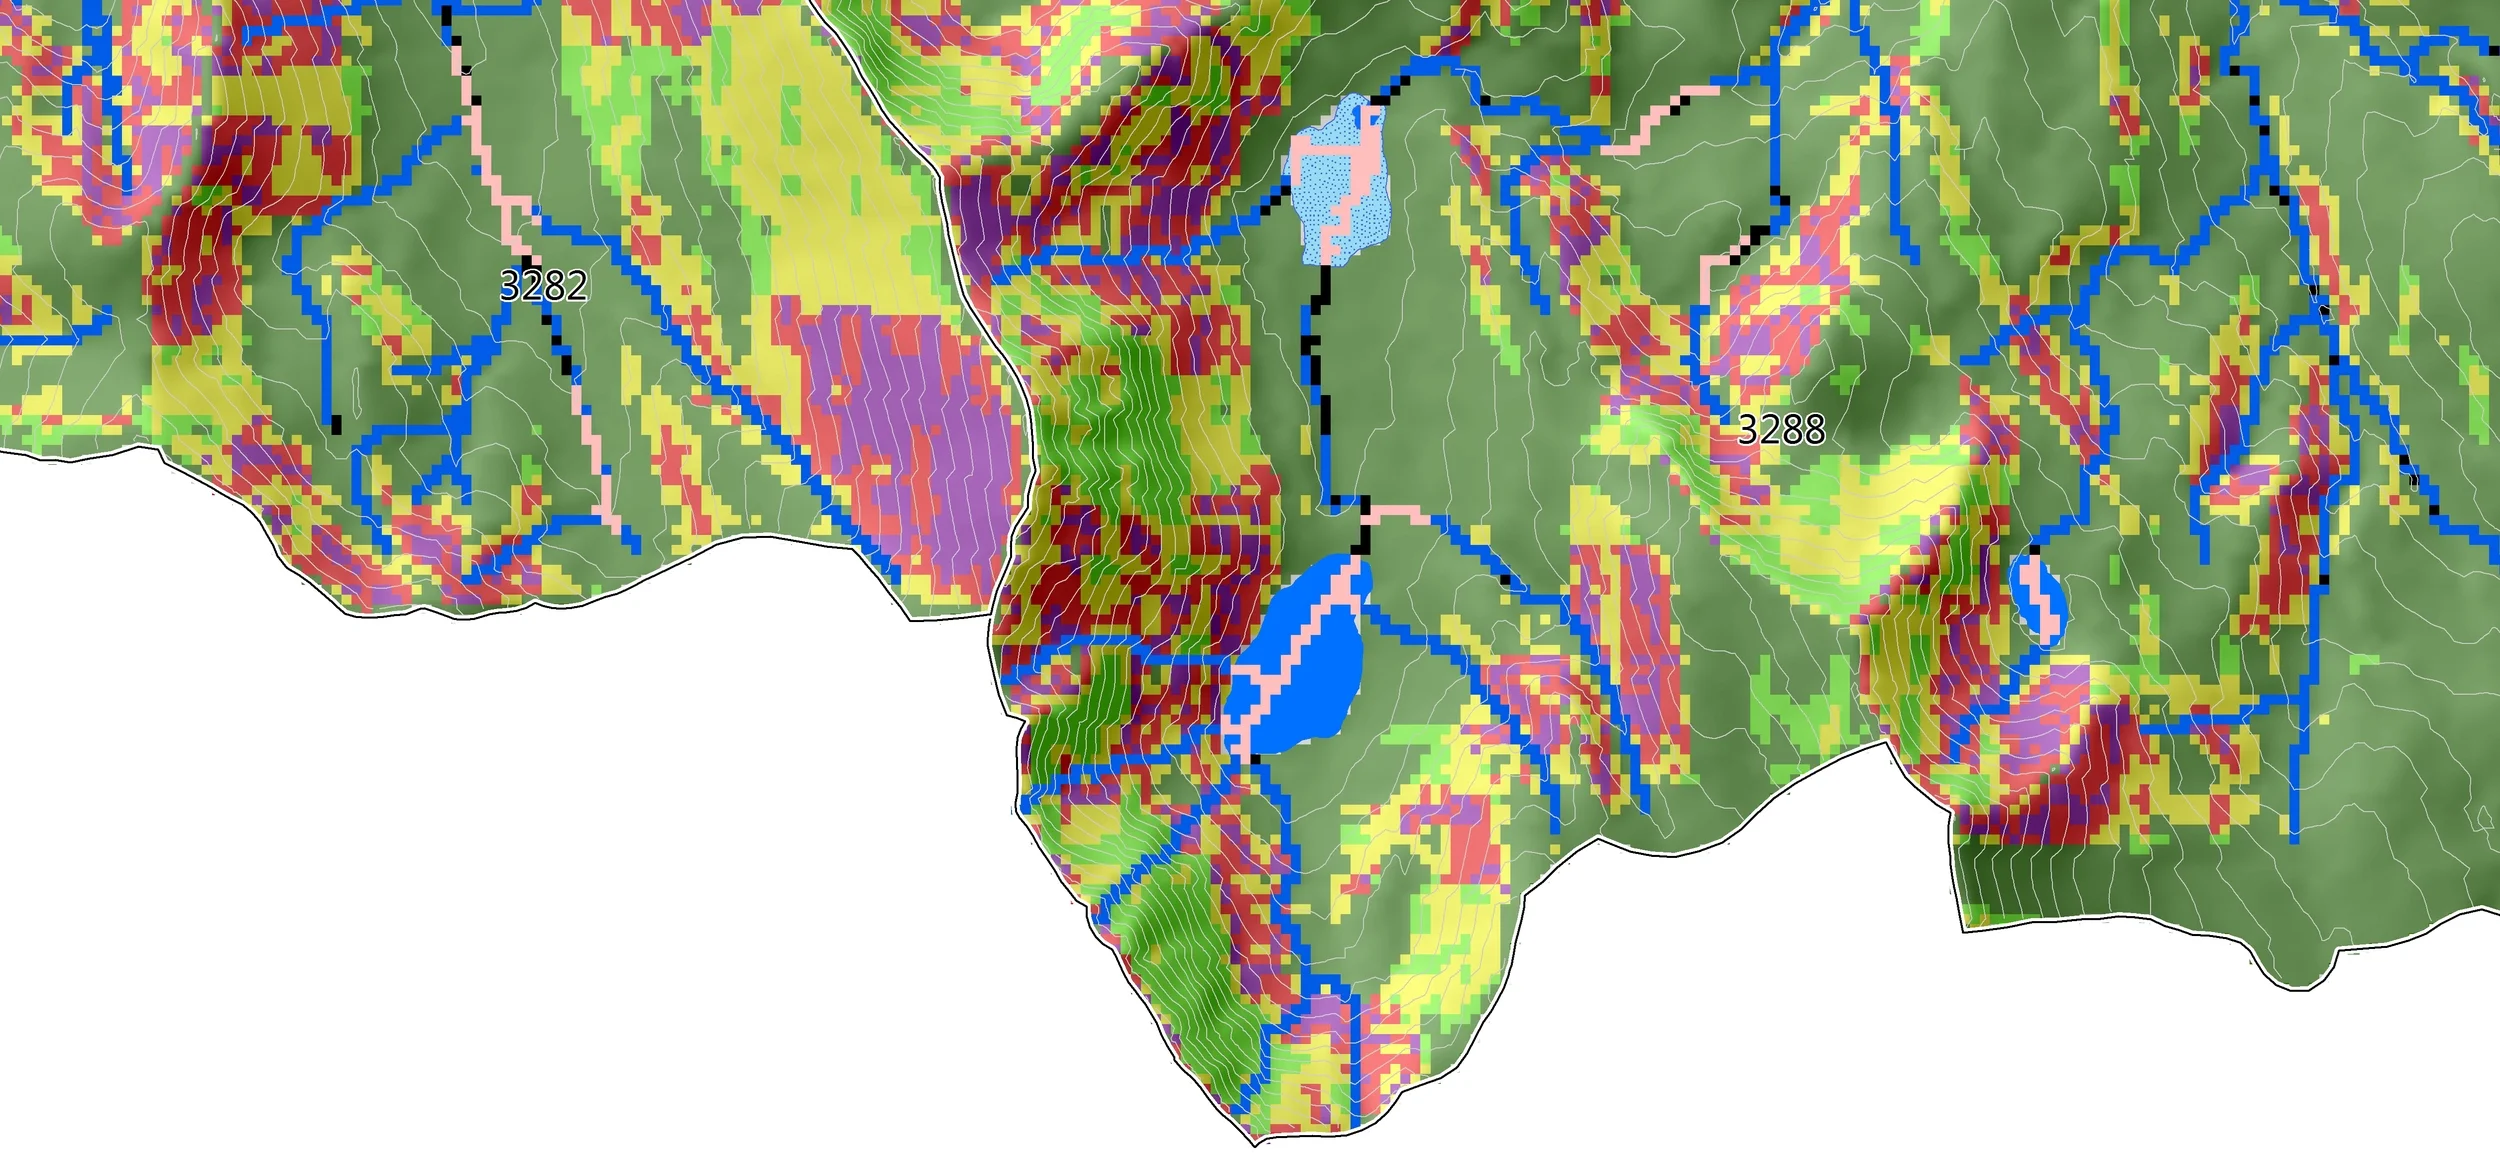
- landslide Likelihood with linkage to fish habitat
Using ESRI's spatial analyst tools I created a landslide likelihood map (A.), then using hydrology tools I was able to retain only those landslide pixels which threaten Class 1 fish habitat (B.). This data analysis was developed using ArcGIS model builder 10.2 in conjunction with hydrologists and landscape ecologists. The model has since been scaled up to the entire southeast region of British Columbia, however publication of our dataset is pending.

values assessment model
Using ESRI model builder, and Python, I created an analysis that provides spatial statistics & detailed map/attribute information for over 60 unique Natural, Cultural & Economic (NCE) data sets within any study area in the province of BC. The resultant interactive map products are viewable to both non-GIS and GIS users. The spatial statistics bar graphs allow for rapid visualization of key NCE features within a study area, while the map product shows spatial distribution & attribute information for the corresponding NCE layers.


- environmental management: Glacier National Park
For nearly fire years I worked directly with environmental scientists at Glacier, and Mt. Rainier National Parks.
The products shown here are from Glacier National Park, including one in support of USGS global change program.


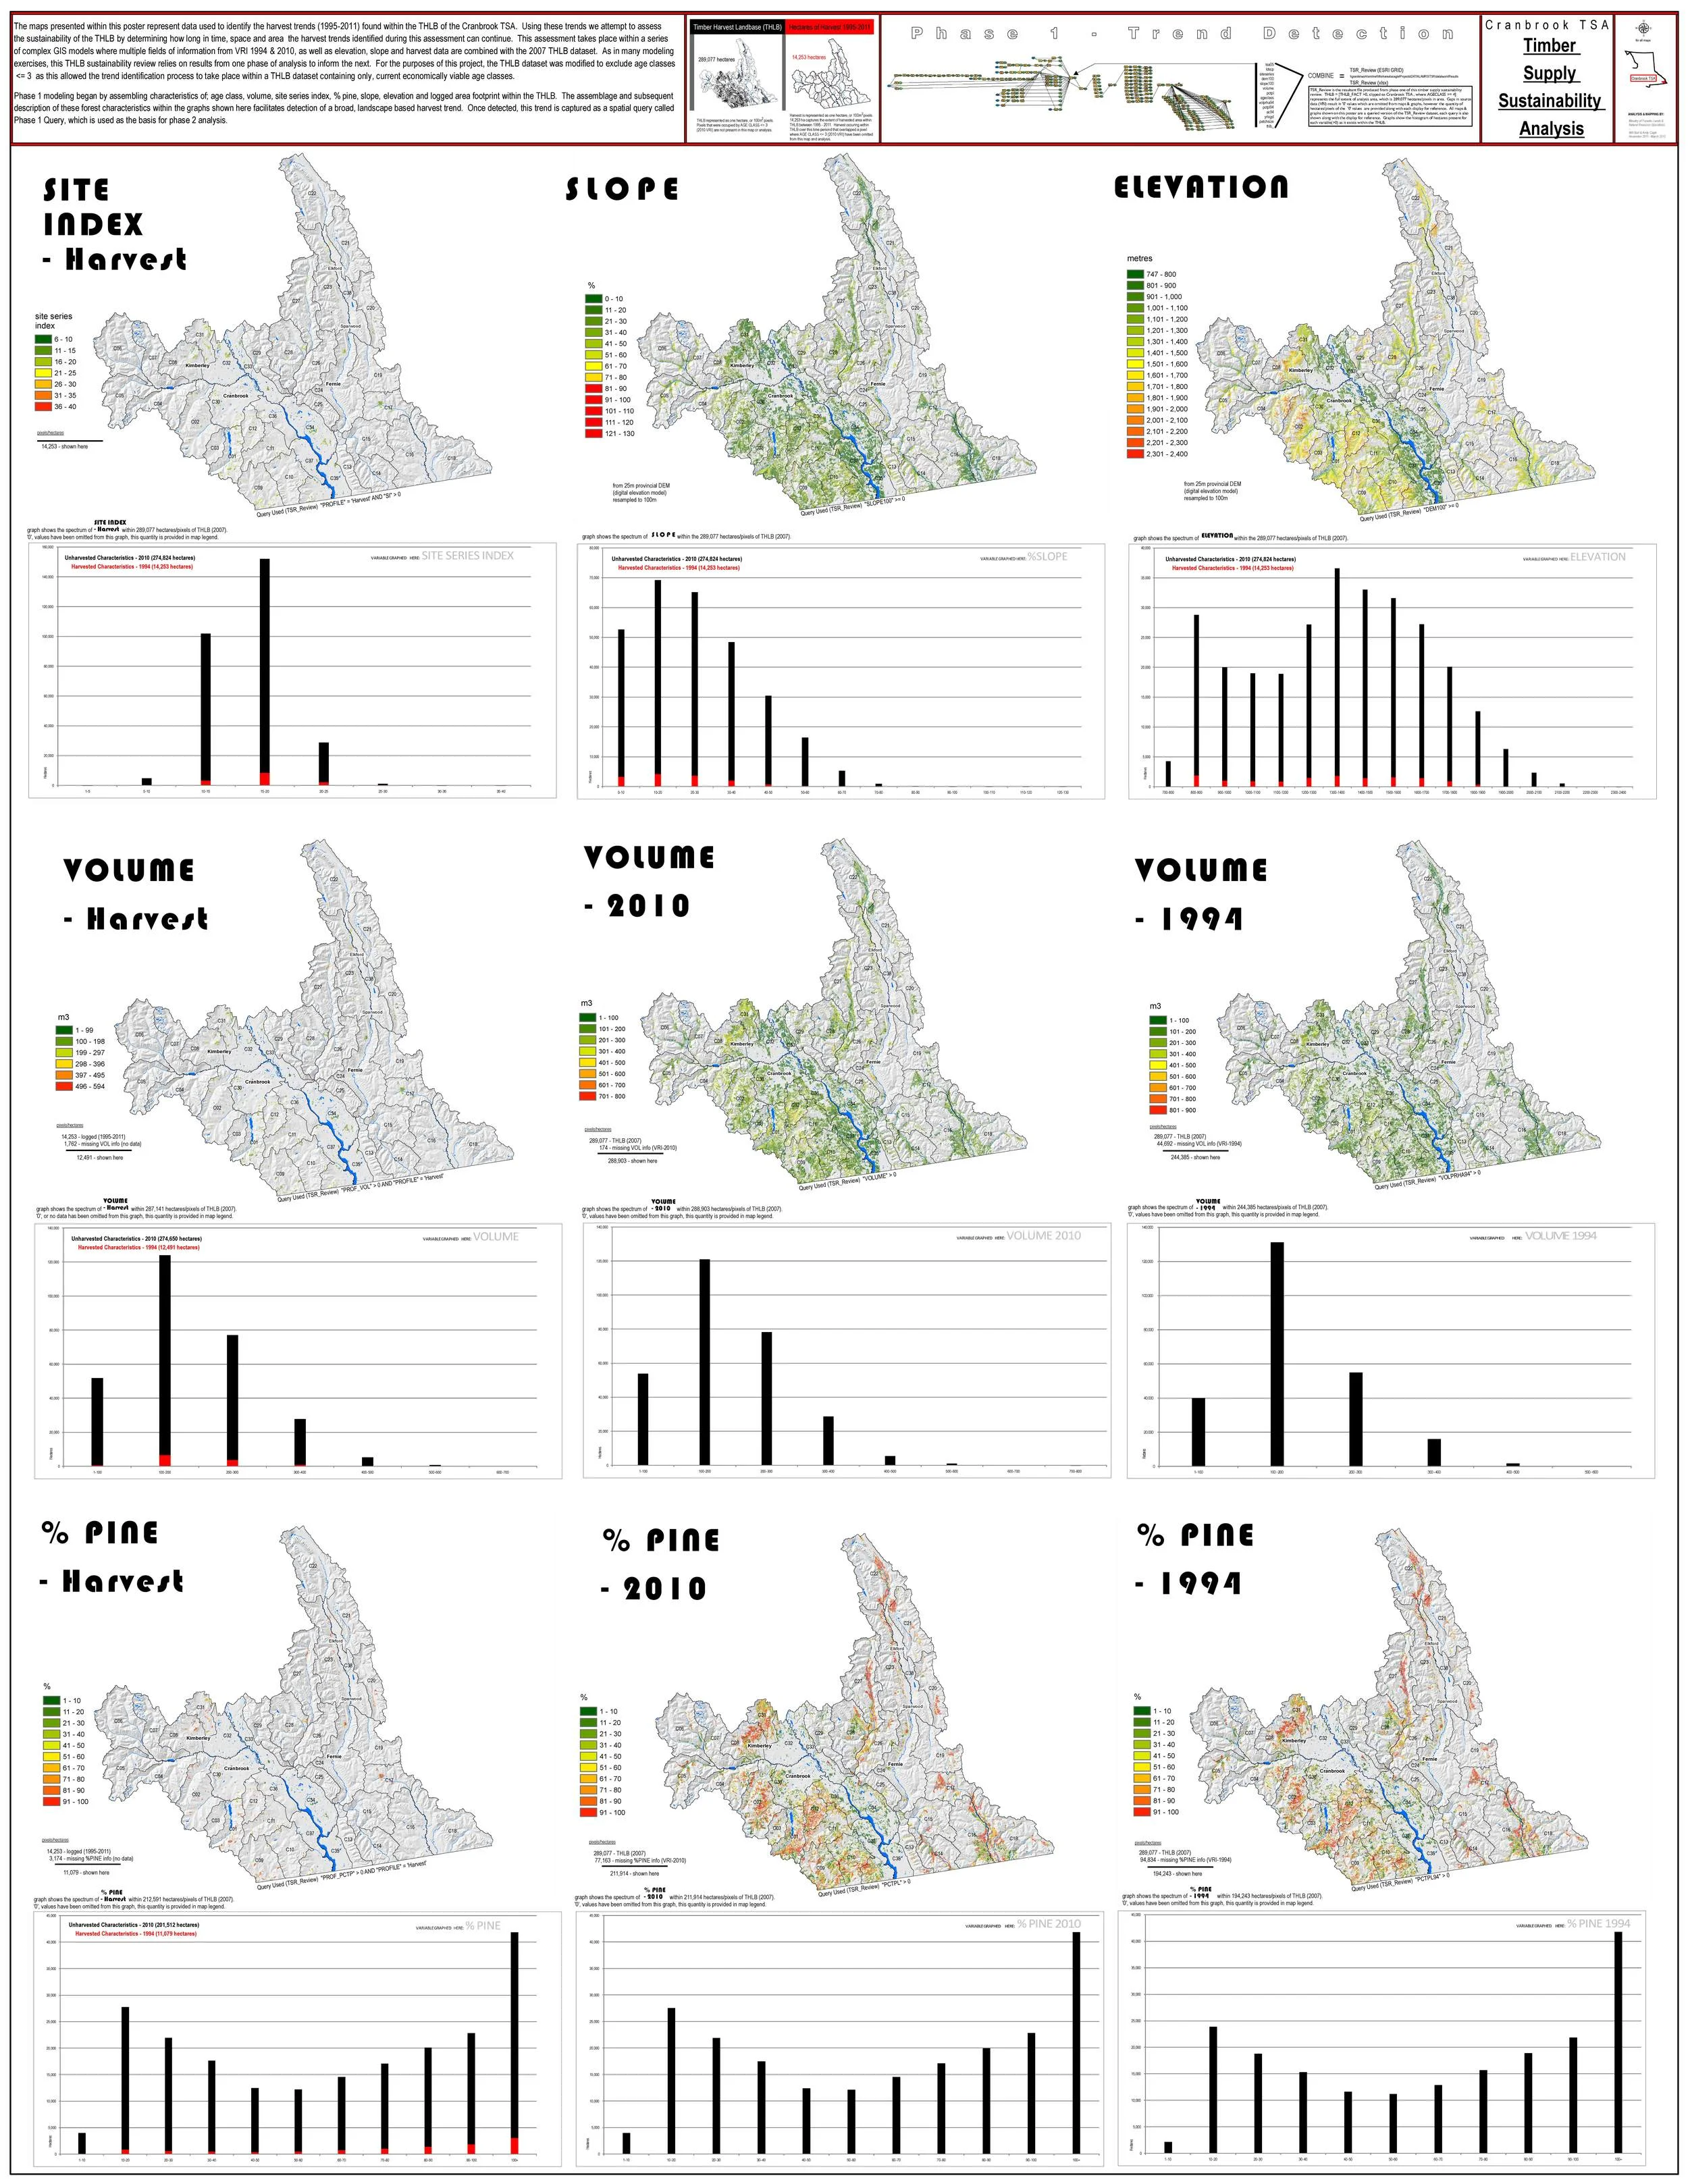
- forest Sustainability assessment -
I performed a spatial and statistical analysis on 20 years of logging data to detect trends in species, aspect, slope, distance from road... Once a trend in logging behaviour was determined, I used ESRI model builder & Python to answer the question of how long can the allotted forest land base sustain the trend in logging behaviour. I provided the posters below and write up in image 3 to government and forest industry planners. A powerful conclusion was made clear in my data visualizations in that the current trend in logging cannot be supported without change in policy or practice.


- Flathead Watershed USA/CANADA
This map provides its audience with a historical and spatial reference for the state, provincial, federal, and international land use designations that have protected the ecological integrity of the transboundary flathead watershed for the past 100 years. The map intends to emphasize how this watershed, with its world class fisheries, is currently under threat from a proposed open pit coal mine located in the British Columbia headwaters of the North Fork of the Flathead River. In the United States, the North Fork of the Flathead River forms the western boundary for the Glacier National Park part of Waterton-Glacier International Peace Park, and has federal designation as a “Wild and Scenic River”.

